Last week, Consumer Price Index (CPI) data indicated that consumer inflation was -0.7 percent lower in January compared to a year ago. We’ve entered deflation territory; the first time this has happened since the 2009 Global Financial Crisis. Of course, this wasn’t entirely an unexpected event—median Bloomberg consensus estimates got pretty close, forecasting a -0.4 percent decline in inflation.
But what does this tell us about the Malaysian economy? And what does deflation exactly mean for the economy? The answer to both of those questions is: well, just about nothing. Contrary to fears that this episode of deflation signals economic turmoil ahead, headline inflation numbers in Malaysia tell us very little about the level of demand in the economy. In a small and open economy like Malaysia, inflationary pressures are more often than not, imported—directed by the vagaries of global oil prices and the quirks of the automatic fuel pricing mechanism. Indeed, simple correlation analyses imply that administered petrol pump prices alone can explain half of the variation in monthly consumer price inflation figures over the past couple of years.
Back when we last experienced deflation sometime in the second half of 2009, it was primarily a symptom of lower global commodity prices rather than an indicator of lower demand in the domestic economy by and of itself. Last month’s dip into deflation was no different. It mainly reflected various transitory factors, which includes the re-floating of petrol prices and the carry-over effect from the 3-month tax holiday which ended in September. Thus, as the acclaimed Malaysian economics blog EconsMalaysia appropriately alludes to, this was materially different from the protracted and persistent deflationary environment experienced in the developed economies after the Financial Crisis.
So, if deflation in January doesn’t presage trouble in the domestic economy, is it then a boon for consumers? Well, not exactly either.
Sure, consumers have certainly temporarily benefited from lower prices for certain goods, and will probably still enjoy lower pump prices for a couple more weeks. But recall that consumer inflation, measured by changes in the CPI, is actually a weighted average of 12 sub-components. These sub-components reflect the various different categories of consumer goods and services; including things like transportation, food, clothing, communications, and recreation. As such, falling headline inflation does not mean that the prices of all goods and services in the economy are falling—prices of different products can rise or fall at different rates.
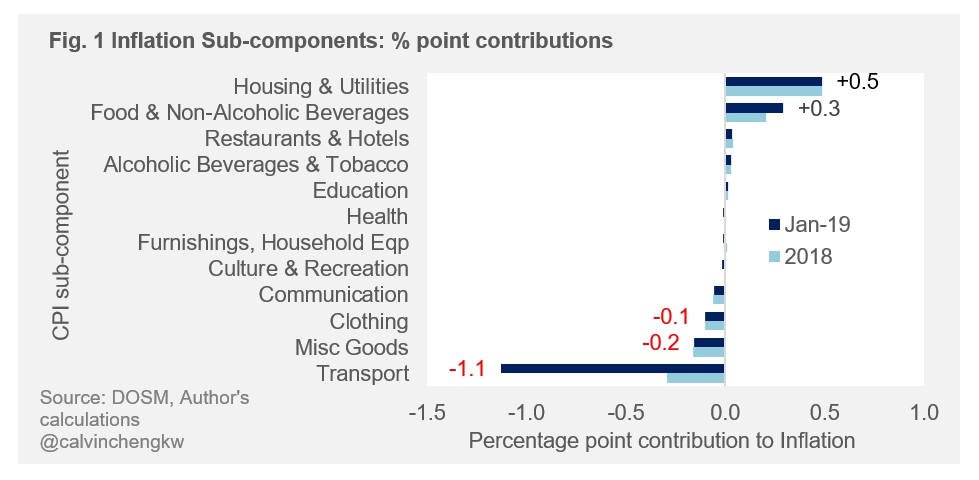
Accordingly, a more comprehensive way to investigate this would be to look at the underlying components that make up the headline inflation figures. We can decompose January’s headline negative inflation figure into its sub-components and see how each sub-component contributed to deflation (Fig. 1). Looking at the percentage point contributions, falling transport costs indeed played a big role in January, subtracting 1.1 percentage points from headline inflation (see Fig. 1). Yet, even as transport costs pulled inflation into negative territory, prices for other goods like housing and utilities, as well as certain food sub-components have continued to climb moderately.

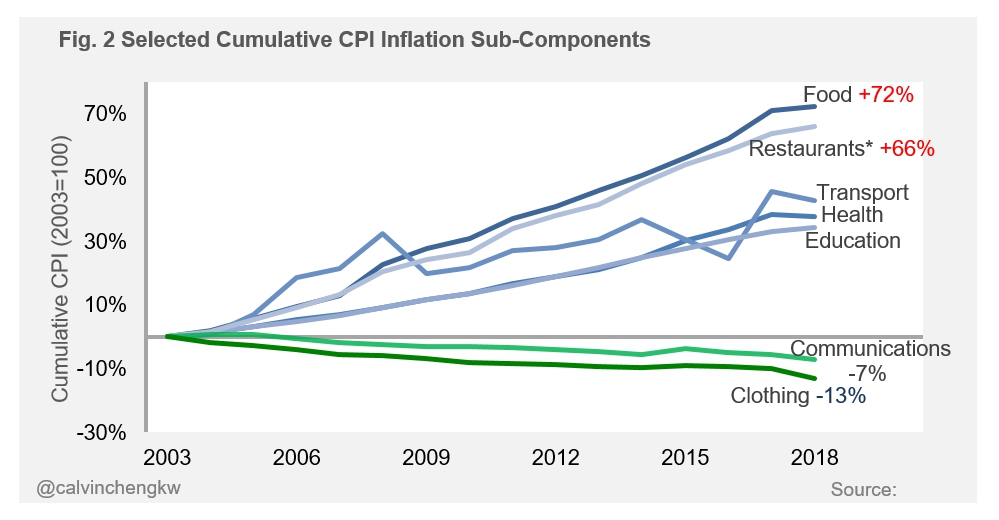
We can go further and investigate which products have become more expensive (and which have actually become cheaper) over the last 15 years by shifting our focus from a single month to looking at cumulative inflation from 2003 to 2018 (see Fig. 2). With this, several interesting trends emerge.

Despite falling transport costs in January, transport costs have actually steadily climbed over the last 15 years. Additionally, prices for other key necessities like food and restaurants have risen the most—cumulatively 72% and 66% higher than in 2003 respectively. Yet, prices for clothing and communications products have actually gotten cheaper since 2003, gradually declining over the last 15 years. This probably reflects increased productivity from technological change and globalisation—just think about the proliferation of free online communications services and internet clothing stores.
But more importantly, this demonstrates why a single month of deflation doesn’t mean consumers have enjoyed lower prices—after all, one month of negative inflation does not negate the decades of cost increases. Taken together, these facts help to illustrate why ‘cost of living is higher despite low inflation’. And because January’s deflation was caused by transitory factors, as oil prices rise (and they already have), consumer prices will soon resume their steadfast trek upwards.
To be sure, inflation is not inherently a bad thing. It is the natural phenomenon of a growing economy. The crux of the issue thus lies in how much real average wages have risen over the same period—something that should be explored in another article. But for now, at least, when confronted with the nostalgia about how cheap a packet of nasi lemak was a decade ago—one can find solace in the fact that prices for communications and clothing products are lower now than they were 15 years ago.


