


The Malaysian Economy: One Decade in Review
How the Malaysian economy has changed over the last decade in 11 charts
Photo: Image by Walkerssk from Pixabay
Graphic design by Ridzwuan Rosli
As we enter February 2020, it is perhaps a good time to pause and take stock: how have the structure and nature of the Malaysian economy changed over the past decade? How have we progressed—and where are we stuck?
Here is a quick look of the Malaysian economy of the 2010s in 11 charts: covering selected measures of economic growth and national income; trade and investment; and household incomes, inequality and poverty.
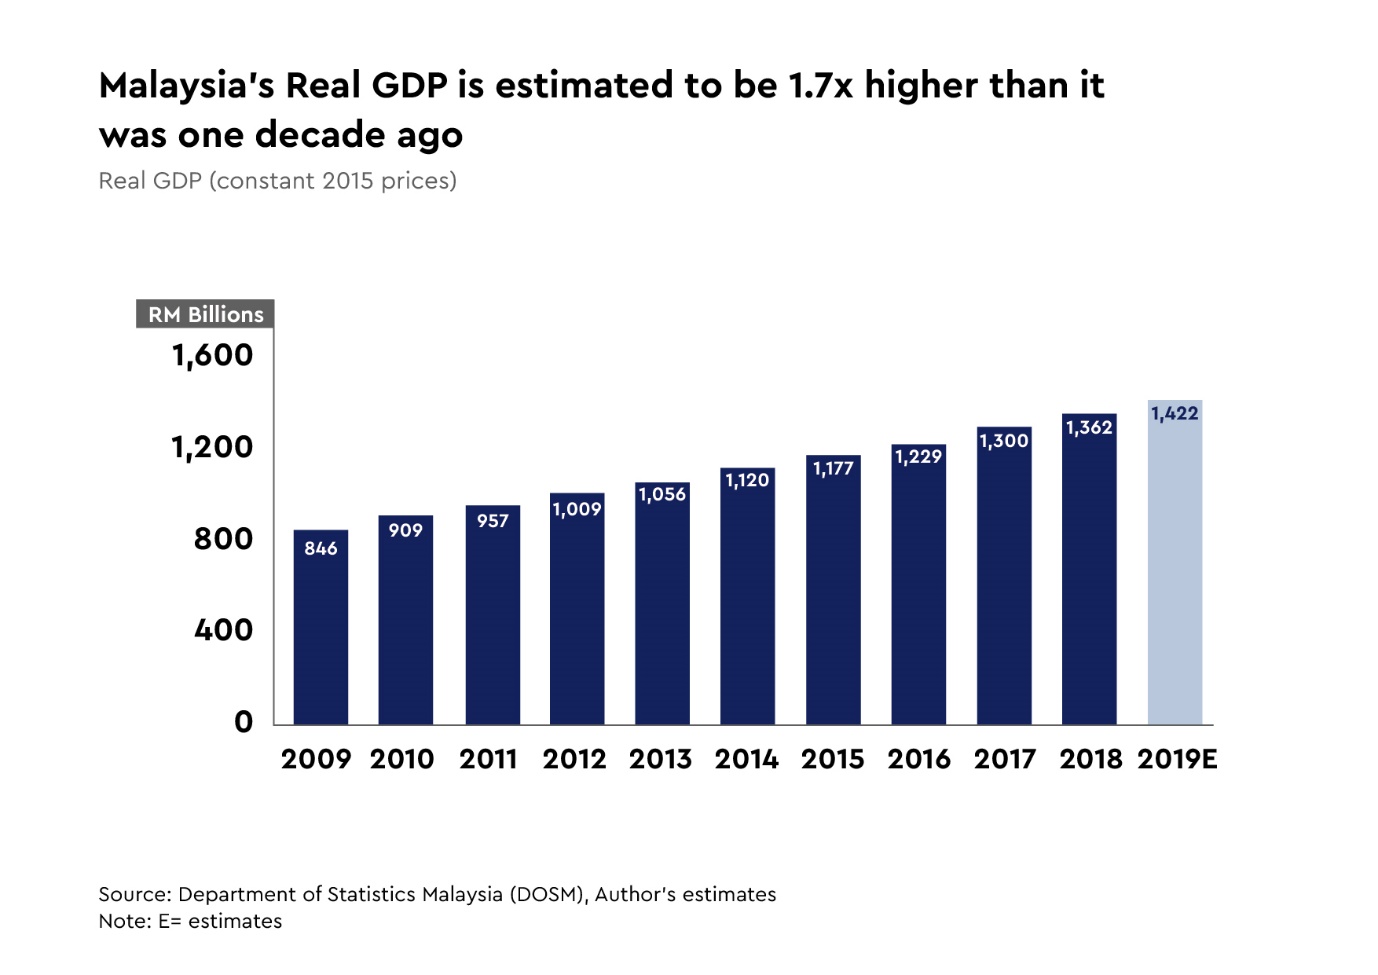
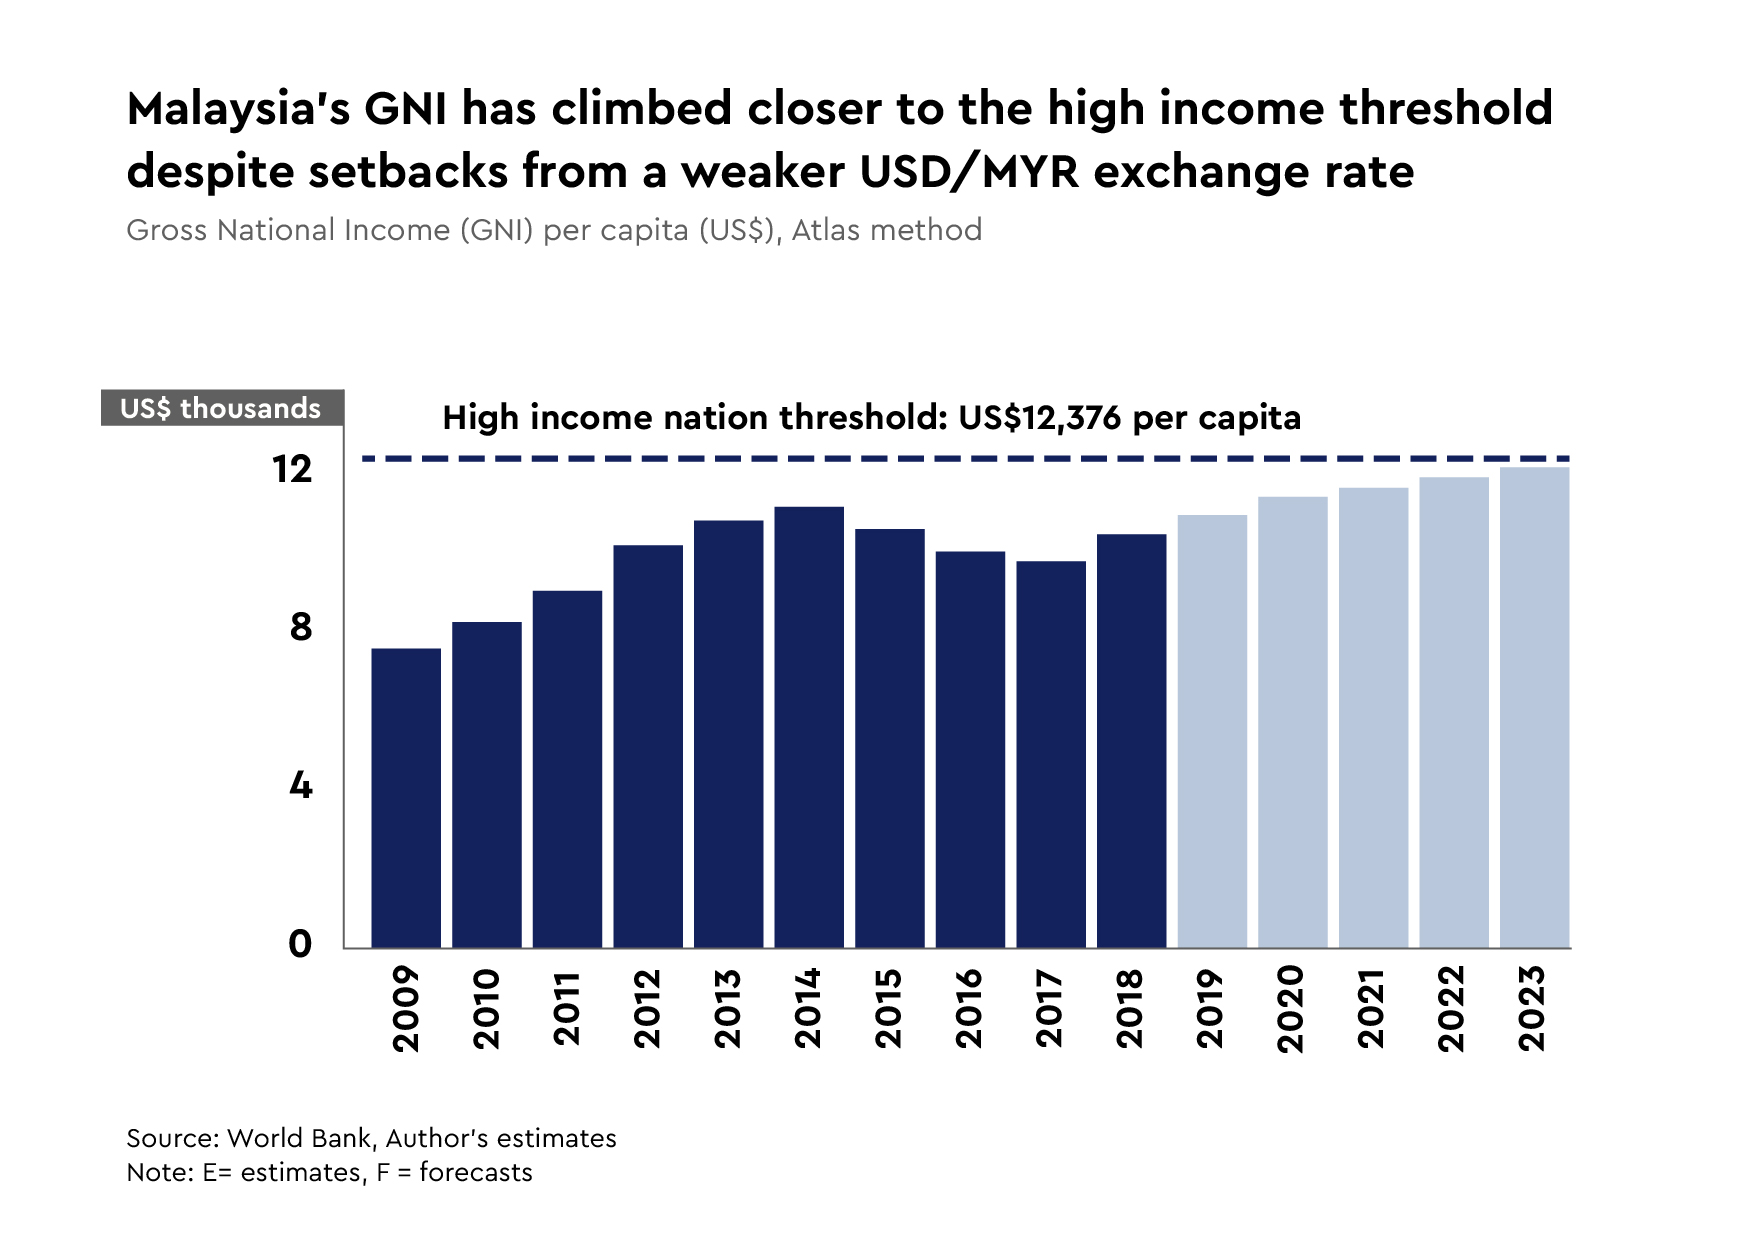
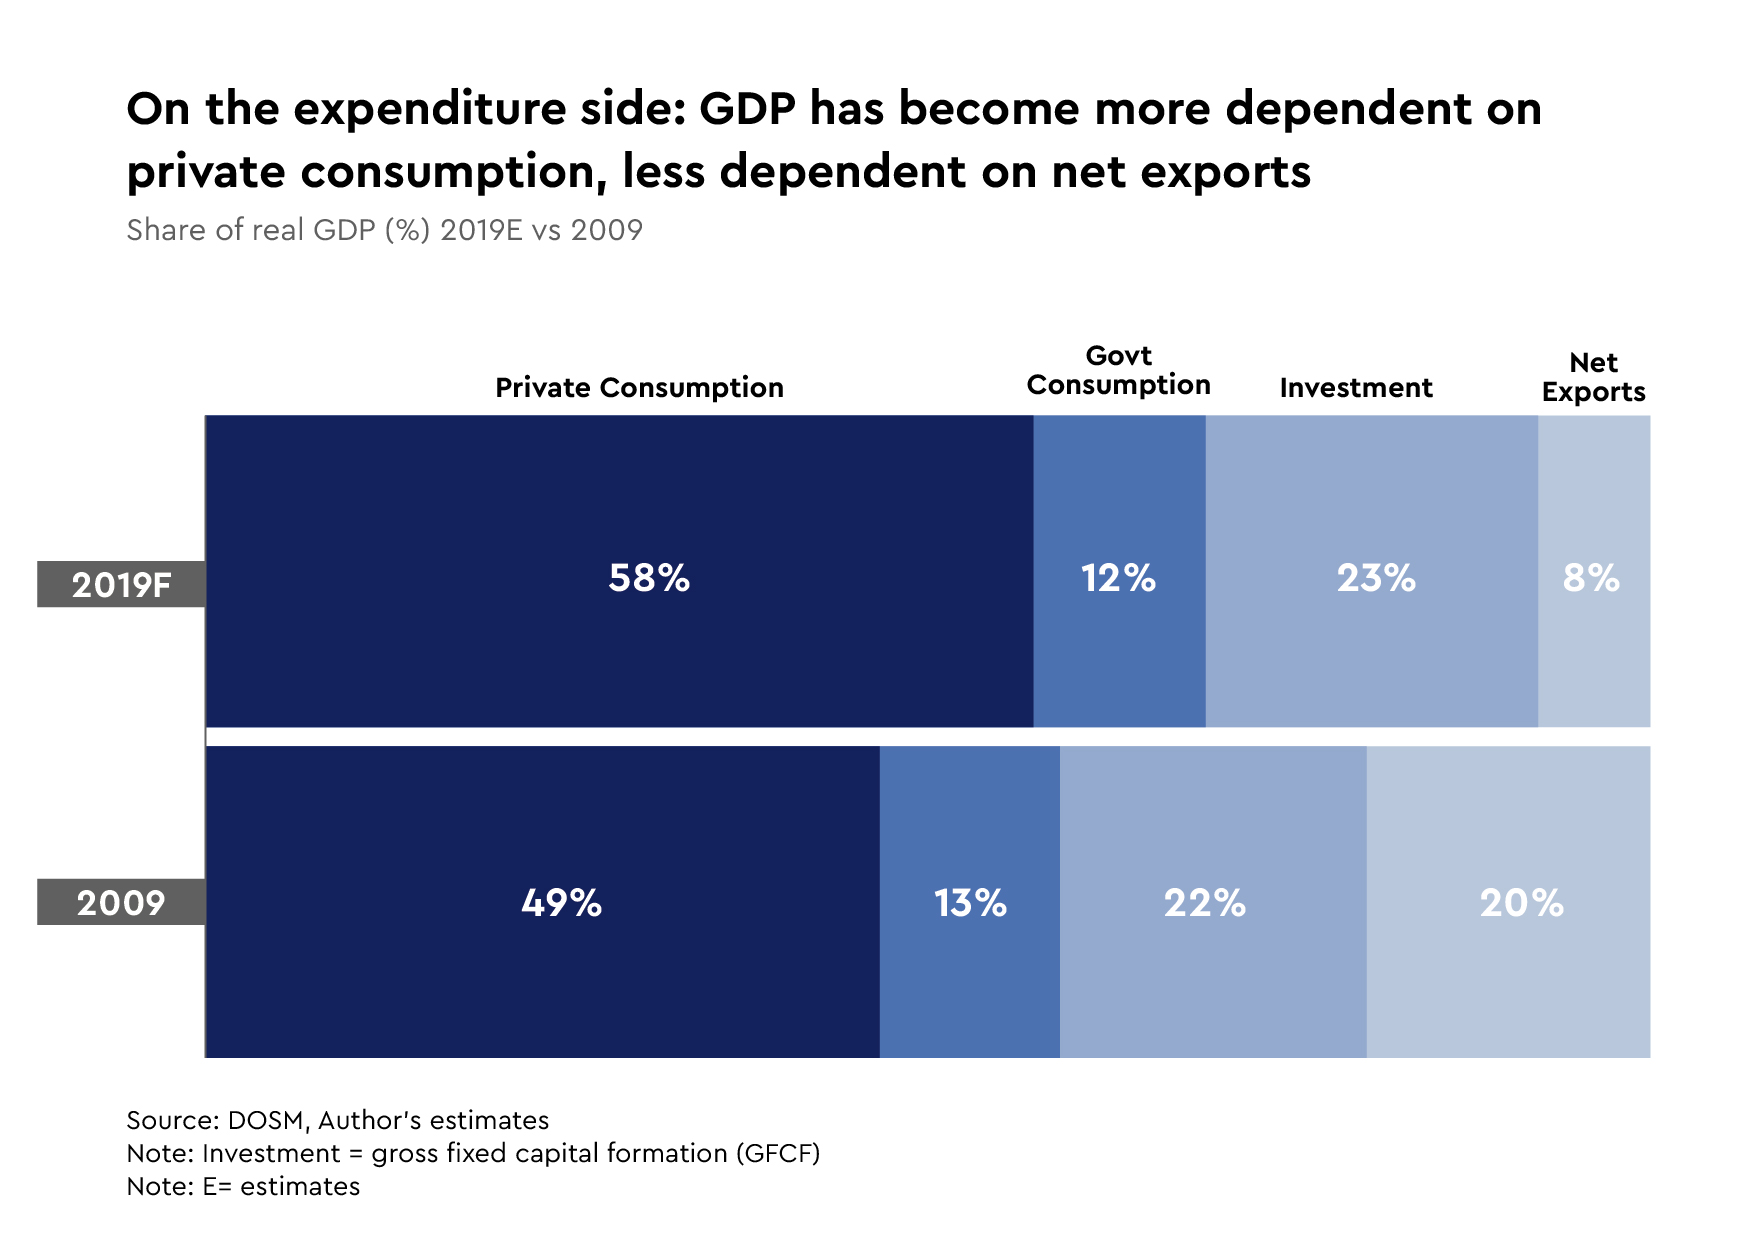
1. Economic Growth: GDP and National Income

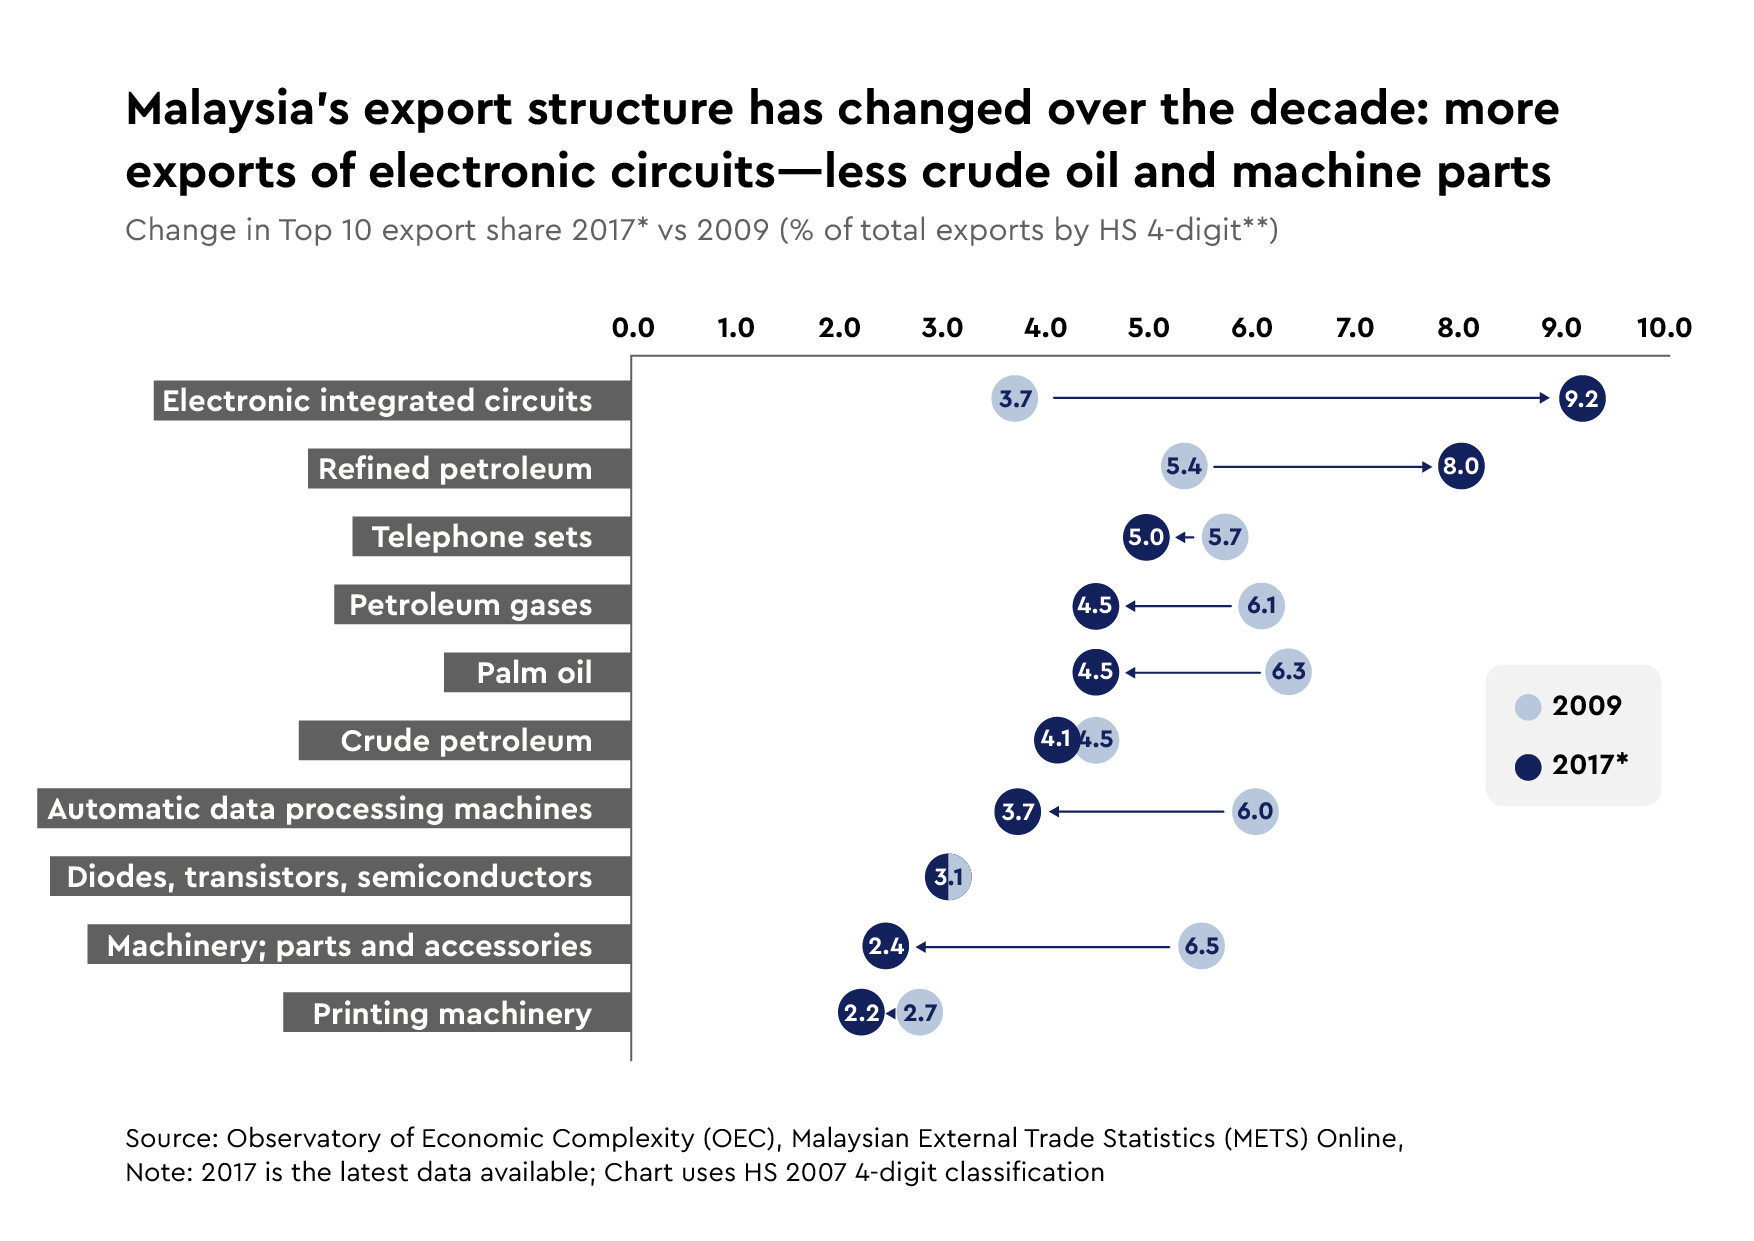
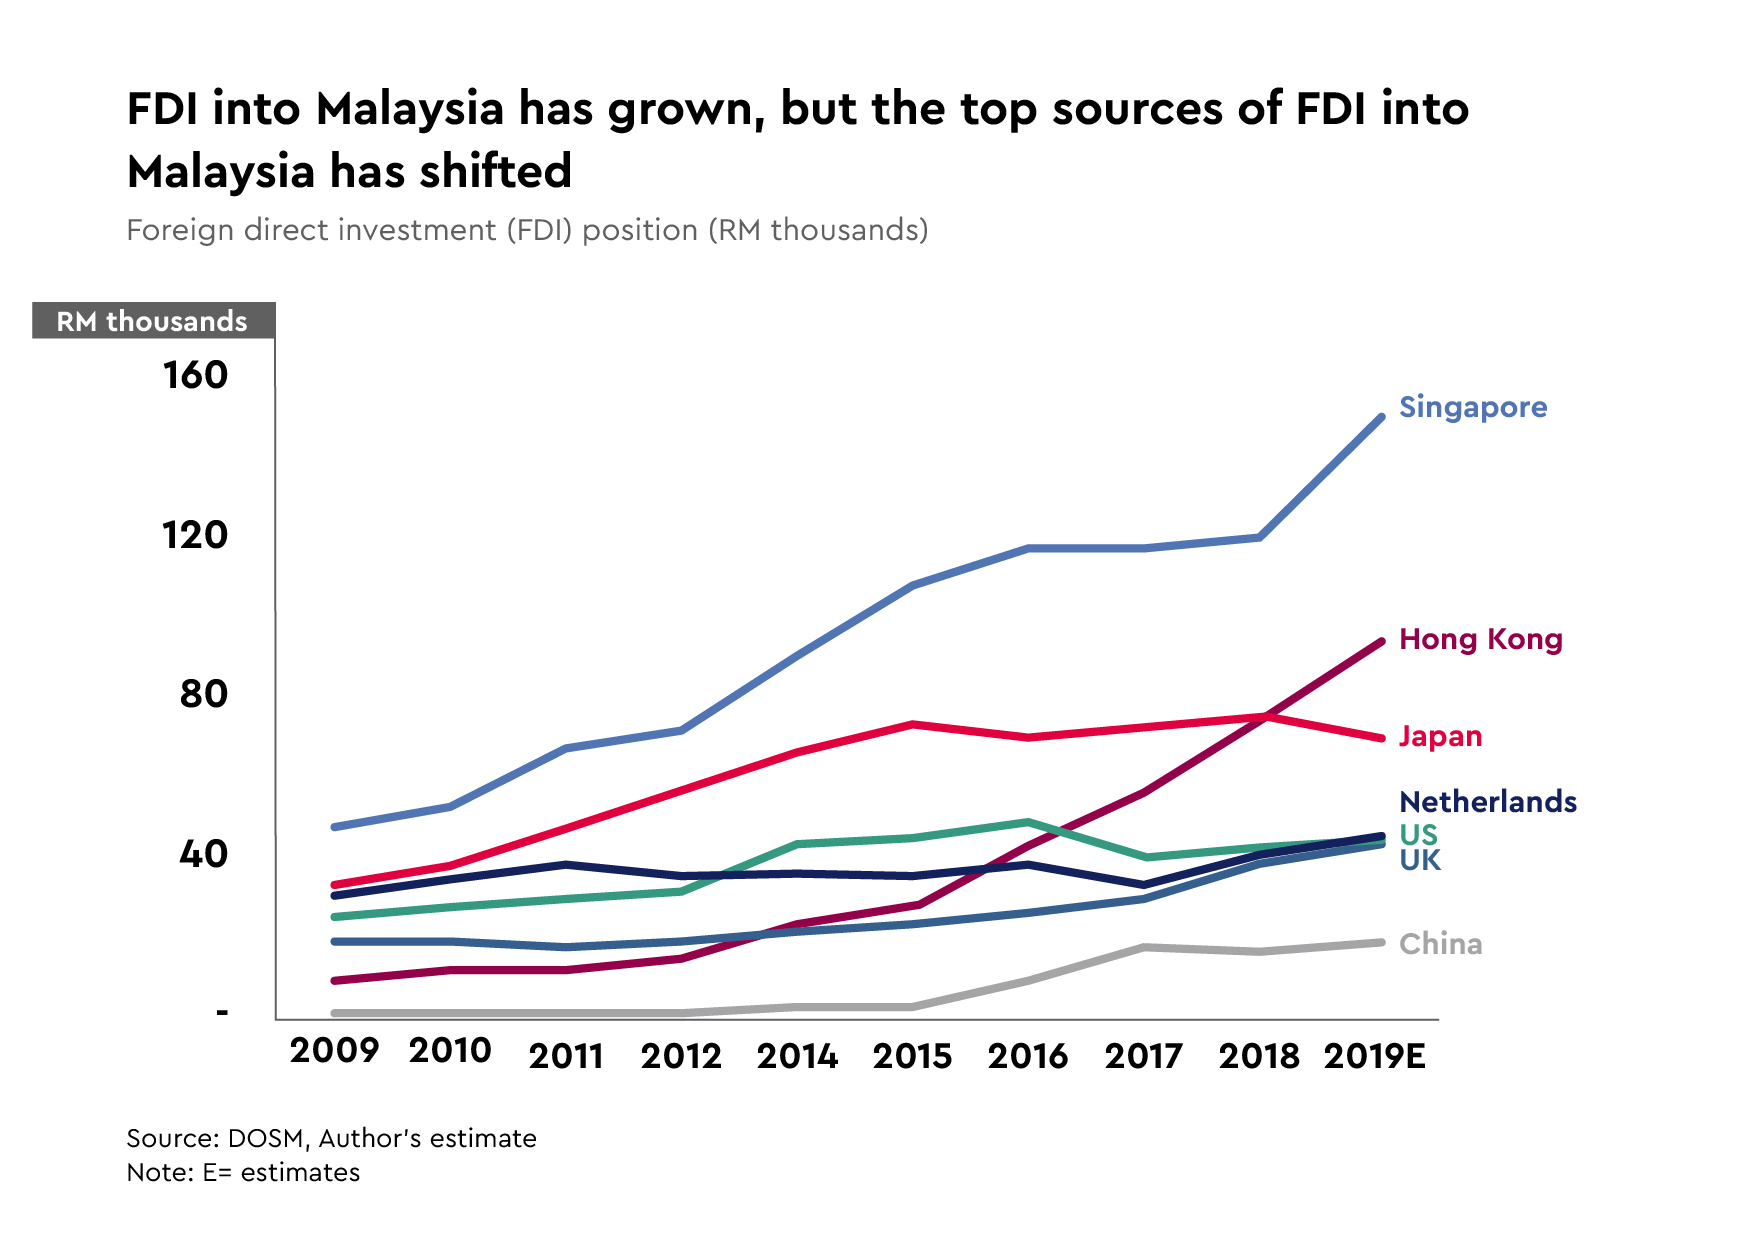
2. Trade and Investment
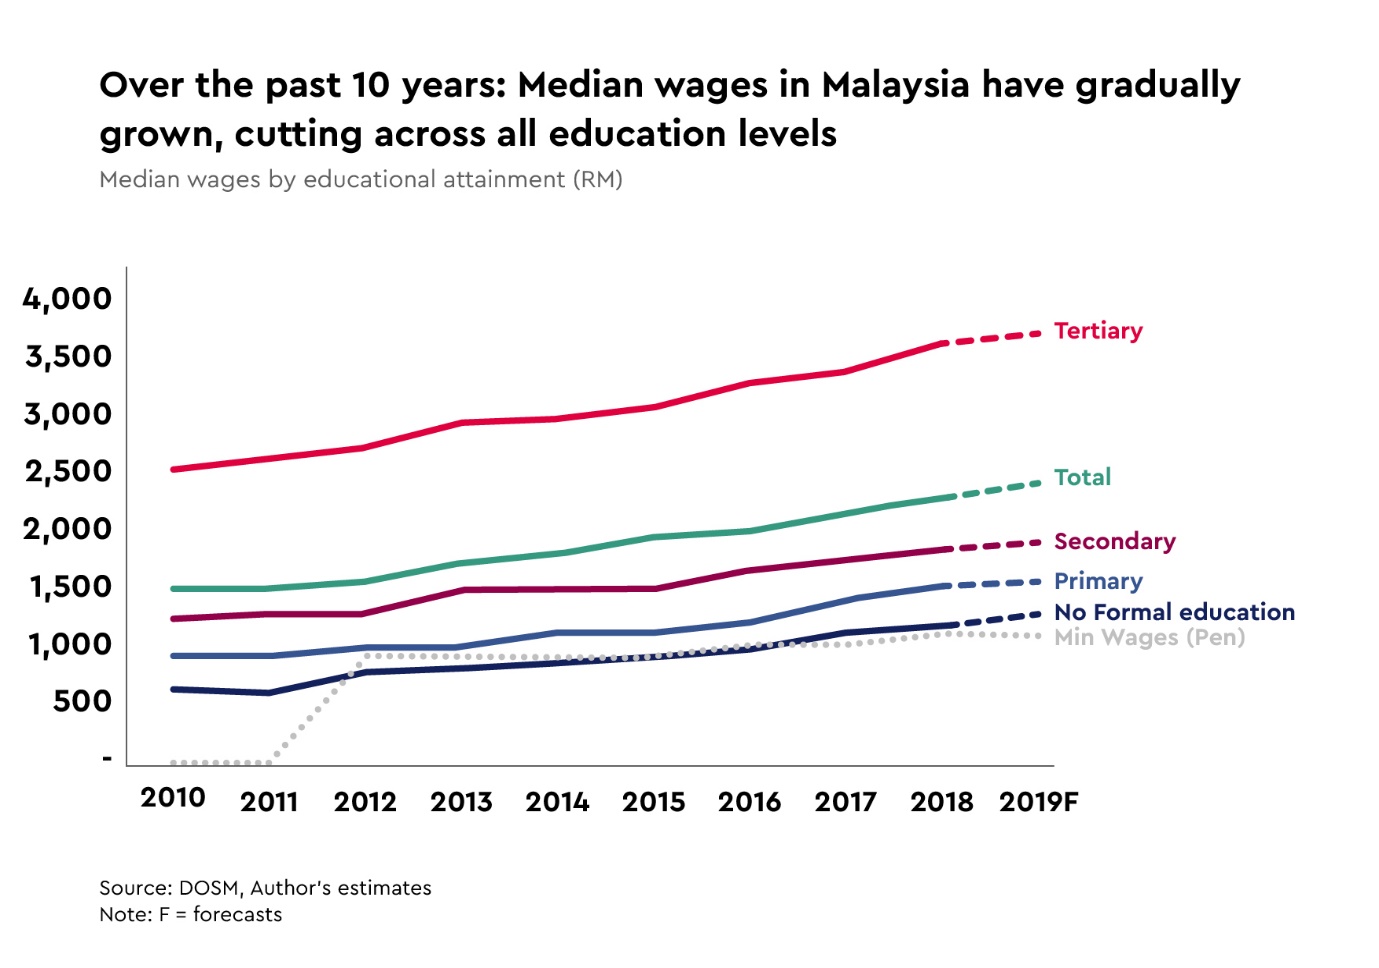
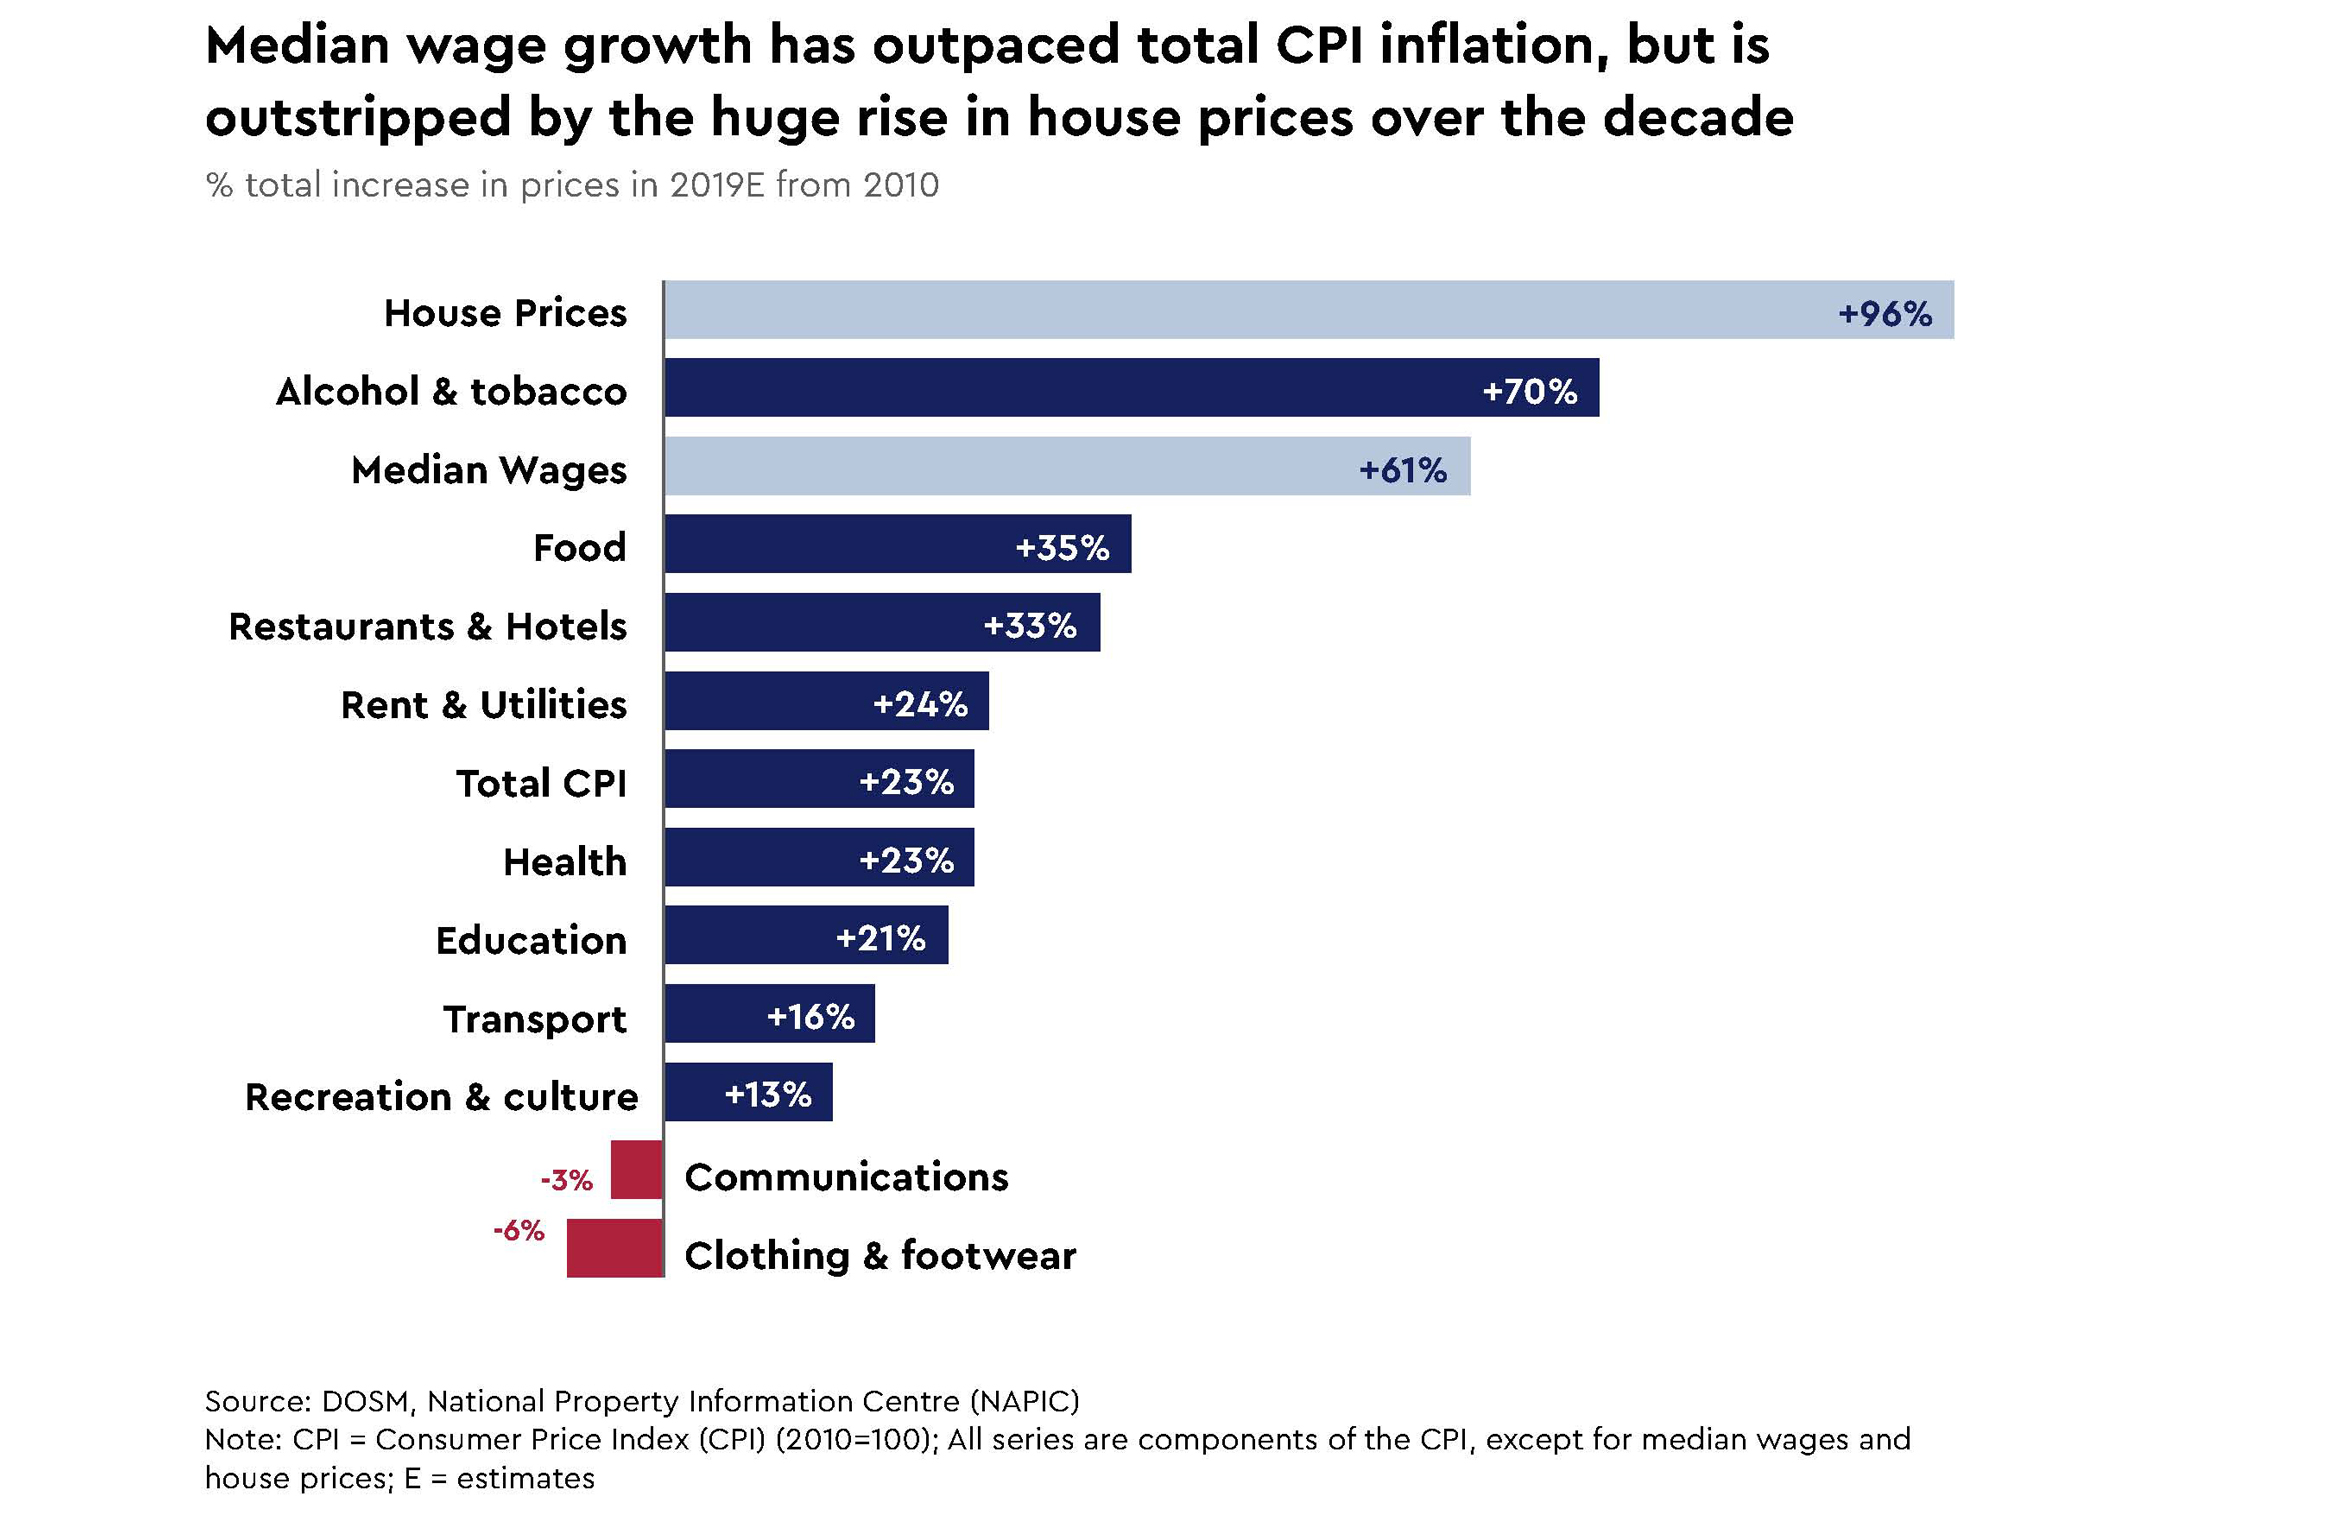
3. Wages & Prices
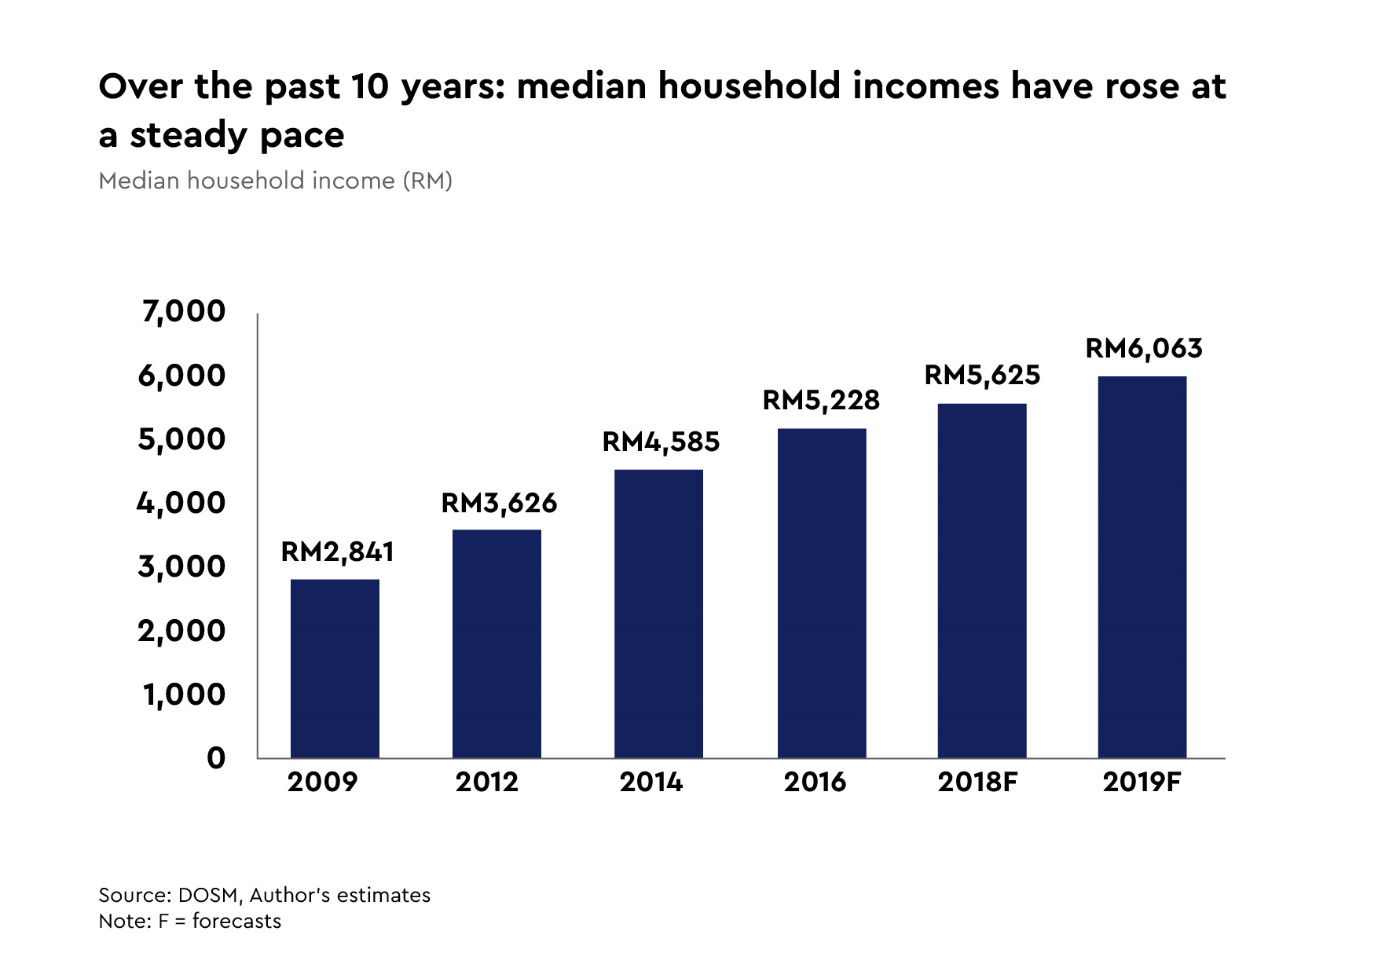
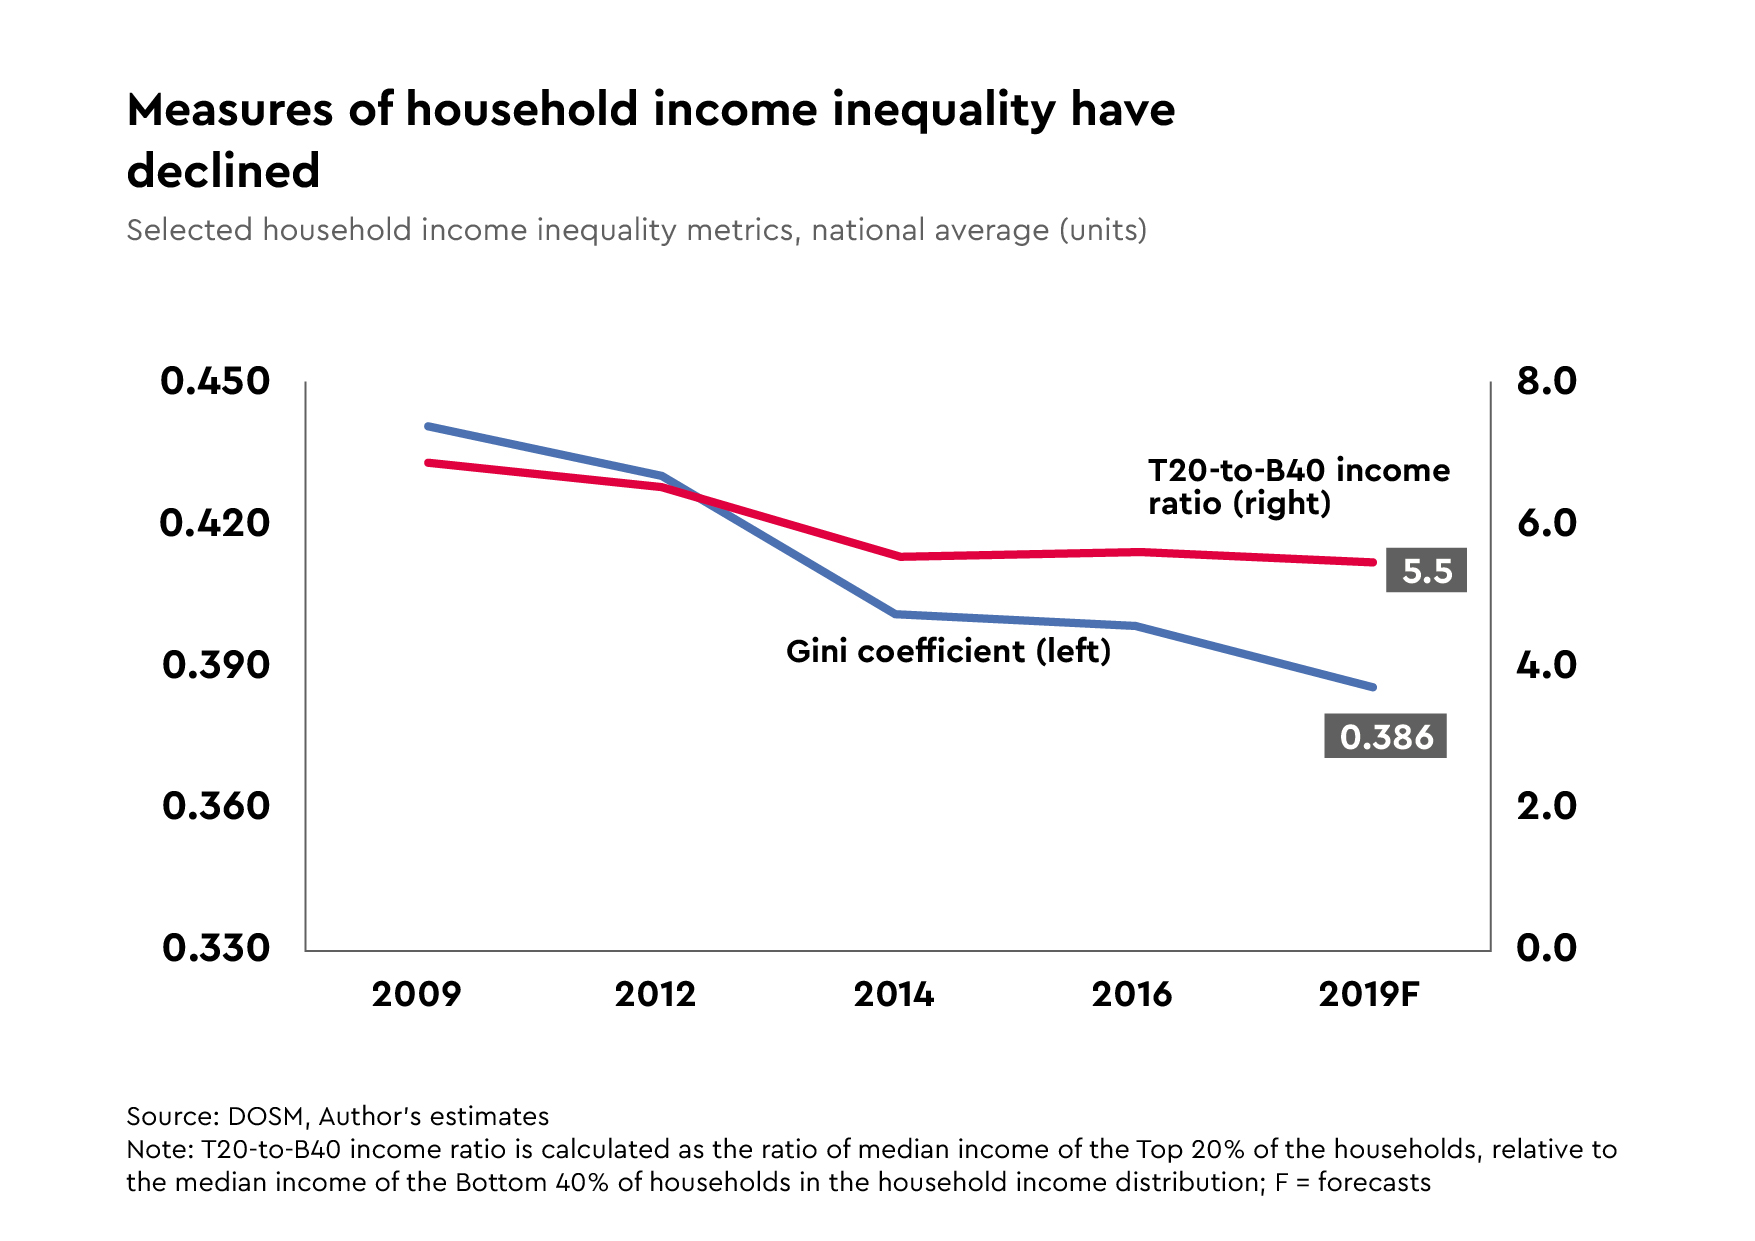
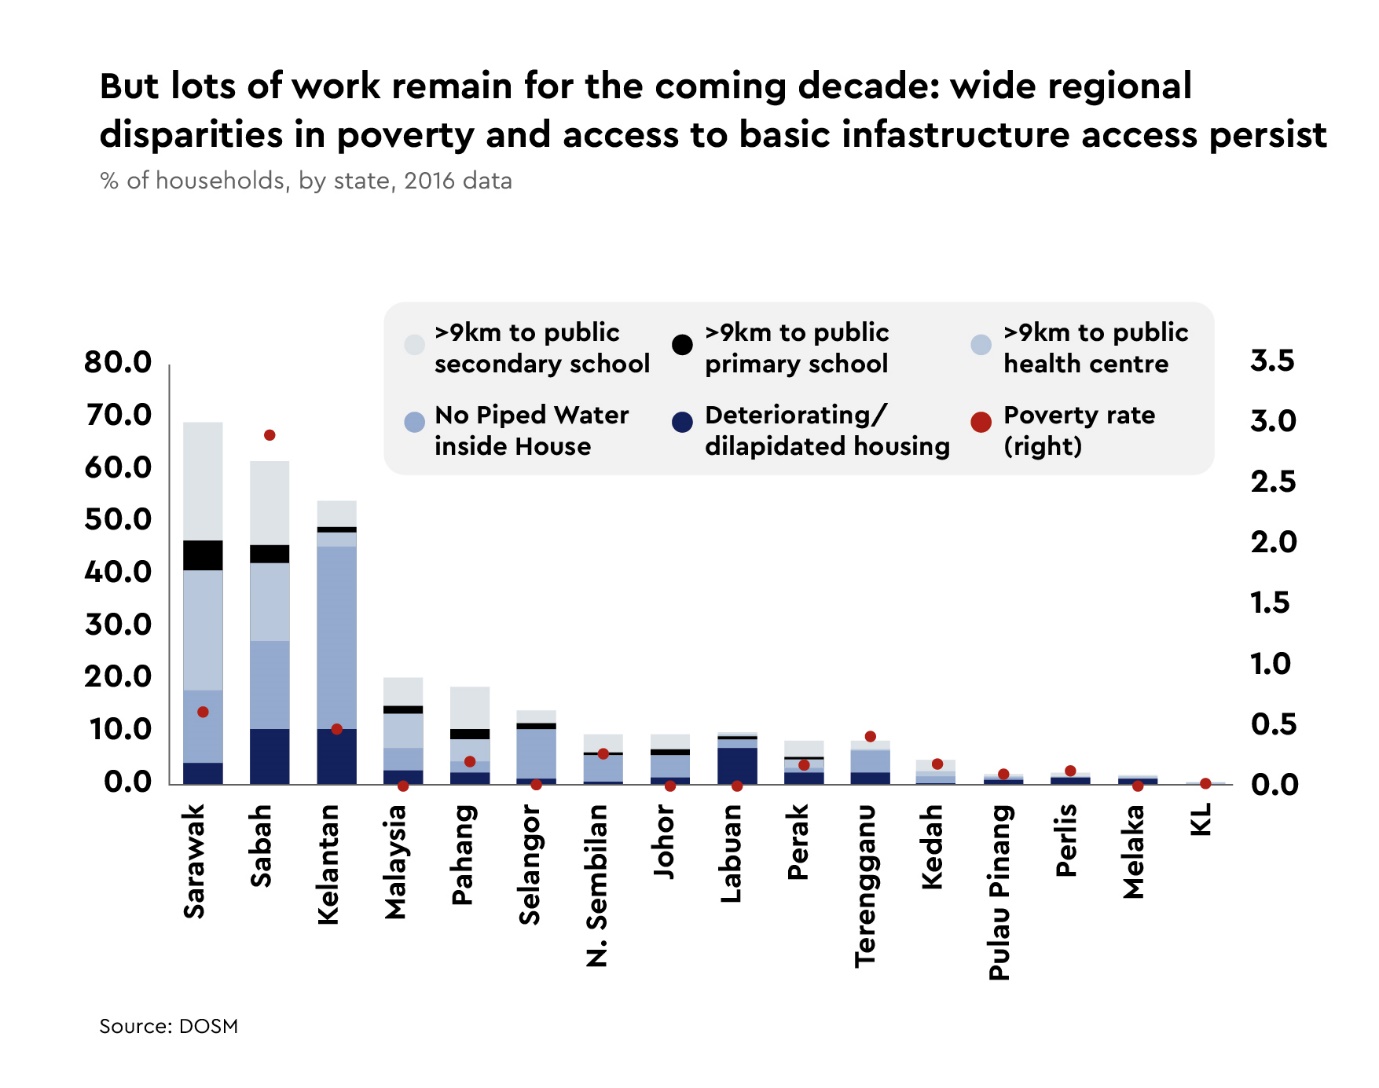
4. Household Incomes, Poverty and Inequality
List of data sources
- Department of Statistics Malaysia (DOSM)
- Household Income and Basic Amenities Survey; various years
- Salaries & Wages Survey; 2018
- Quarterly International Investment Position (IIP); various years
- Quarterly National Account – Gross Domestic Product; various years
- Statistics Yearbook Malaysia; 2018
- Consumer Price Index (CPI); November 2019
- World Bank Open Data
- GNI per capita, Atlas method, https://data.worldbank.org/indicator/NY.GNP.PCAP.CD?locations=MY
- National Property Information Centre
- All House Price Index (AHPI)